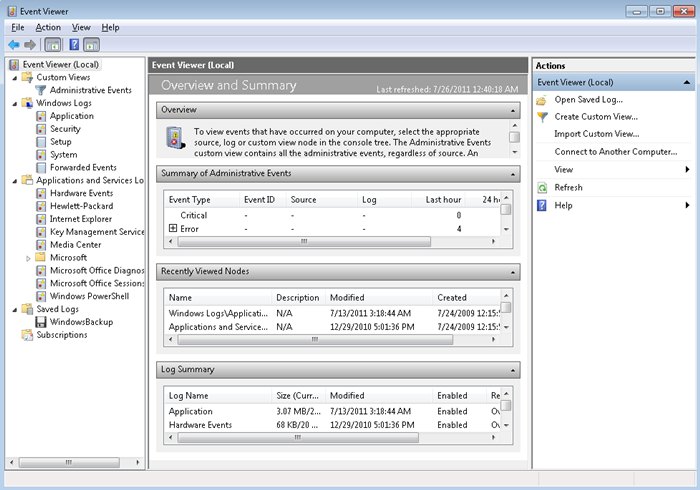
Event Viewer is a utility that is used to view and manage logs of system, application, and security events on a computer. Event Viewer gathers information about hardware and software problems and monitors Windows security events.
You must have administrative permission to open the Event Viewer. You can Open Event Viewer by clicking the Start button, then Control Panel, then System and Maintenance, then Administrative Tools, and then double-clicking Event Viewer. Another way is to click the Start button and then type Event Viewer into the search box. It is also part of the Computer Management Console. You can also open it by executing eventvwr.msc at a command prompt or using the Run option.
Event Viewer tracks information in several different logs. Windows Logs include:
Application - Events are classified as error, warning, or information, depending on the severity of the event. An error is a significant problem, such as loss of data. A warning is an event that isn't necessarily significant, but might indicate a possible future problem. An information event describes the successful operation of a program, driver, or service.
Security - These events are called audits and are described as successful or failed depending on the event, such as whether a user trying to log on to Windows was successful.
Setup - This enables you to more easily review the actions that occurred during Windows Setup and to review the performance statistics for different parts of Windows Setup. The Windows Setup performance events are saved into a log file called Setup.etl, which is available in the %WINDIR%\Panther directory of all Windows 7 installations.
System - System events are logged by Windows and Windows system services, and are classified as error, warning, or information.
Forwarded Events - These events are forwarded to this log by other computers.
These logs can be very long and tedious to go through. In those cases, you can use the Filter Current Log option in the right pane to narrow down the results. Filters are not persistent, however, you can create filters for future use by clicking Create Custom View in the right pane. This brings up the same window as the filtering option, however, it stores the view in the Custom Views section of the left pane.
In some situations, it may be necessary to examine the event logs from multiple computers at the same time. In these cases, Windows 7 can be a collector of event logs from other computers, or forward its own event logs to another computer. To learn more about this, read Event Subscriptions.
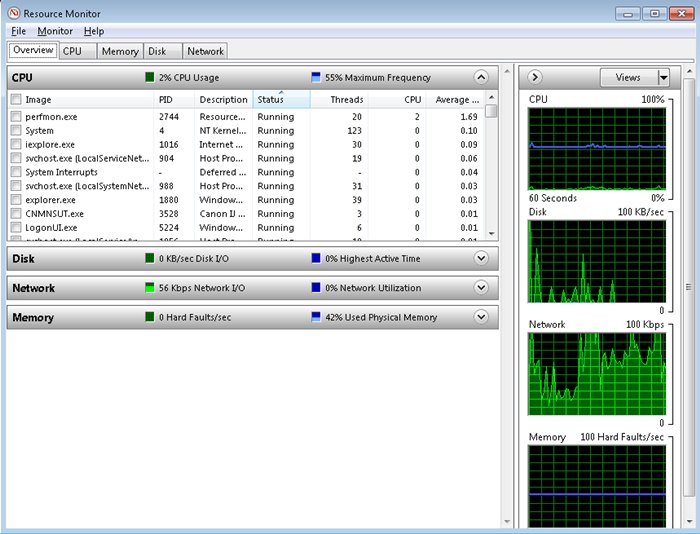
Resource Monitor:
Windows 7 Resource Monitor provides a quick summary of overall CPU, disk, network and memory utilization. Resource Monitor can be used to see which programs and/or services are consuming Windows 7 system resources, and it is also a good troubleshooting tool if any programs are crashing. In short, Resource Monitor builds on Task Manager by adding more detailed information and graphs in one easy-to-use interface.
To open Resource Monitor, type resmon in the Start menu's search box. The default window appears with the Overview tab displayed. In the Overview tab, you can see the four monitored resources -- CPU, disk, network and memory - with their corresponding graphs as shown below.
Click on the CPU, Disk, Network, or Memory bars to expand information about that resource.
Performance Monitor:
The Performance Monitor utility is used to measure the performance of a local or a remote computer on the network. Performance Monitor enables you perform following activities:
Collect data from your local computer or remote computers on the network. You can collect data from a single computer or multiple computers concurrently.
View data as it is being collected in real time, or previously collected data.
You can control data collection by selecting which specific objects and counters will be collected.
You can choose the sampling parameters (time interval) that will be used, for collecting data points and the time period that will be used for data collection.
Determine the format in which data will be viewed, that is, in line, histogram bar, or report views.
Create HTML pages for viewing data.
Create specific configurations for monitoring data that can then be exported to other computers for performance monitoring.
Windows 7 Performance Monitor includes the new data collector set. This tool works with performance logs, manages where Performance Monitor logs are stored and when the log needs to run. The data collector sets also define the credentials used to run the set.
Data collector sets are used to collect data into a log so that the data can be reviewed. You can view the log files with Performance Monitor. Data collector sets can collect the following data:
Performance counters
Event trace data
System configuration information
Windows 7 includes the following four data collector sets that are stored within the System subfolder:
LAN Diagnostics
System Diagnostics
System Performance
Wireless Diagnostics
Follow these steps to access Performance Monitor:
Click Start, then click Control Panel and then click System and Security.
Click Administrative Tools and then click Performance Monitor.
Alternatively, you can click the Start button and enter perfmon into the search box.
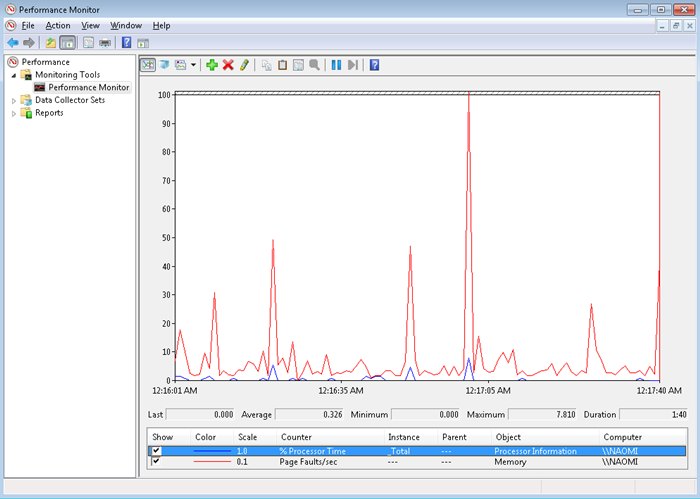
The Overview Of Performance Monitor page is displayed. The System Summary pane of this page gives a snapshot of which resources are being used in your computer. The four initial resources that are tracked are: Memory, Network Interface, Physical Disk, and Processor Information. You can view detailed information about each resource by clicking the Open Resource Monitor link.
Important Performance Monitor Counters:
The following three counters are the three most important counters for monitoring memory:
Memory - Available MBytes: Available MBytes measures the amount of physical memory that is available to run processes on the computer. If this number is less than 20 percent of your installed memory, it indicates that you might have an overall shortage of physical memory for your computer, or you possibly have an application that is not releasing memory properly. You should consider adding more memory or evaluating application memory usage.
Memory - Pages/Sec: Pages/Sec shows the number of times the requested information was not in memory and had to be retrieved from disk. This counters value should be below 20; for optimal performance, it should be 4 or 5. If the number is above 20, you should add memory. Sometimes a high Pages/Sec counter is indicative of a program that is using a memory - mapped file.
Paging File - % Usage: % Usage indicates the percentage of the allocated page file that is currently in use. If this number is consistently over 70 percent, you might need to add more memory or increase the size of the page file.
You can track processor utilization through the Processor and System objects to determine whether a processor bottleneck exists. The following counters are the most important counters for monitoring the system processor:
Processor - % Processor Time: This measures the time that the processor spends responding to system requests. If this value is consistently above an average of 80 percent, you likely have a processor bottleneck.
Processor - Interrupts/Sec: This shows the average number of hardware interrupts received by the processor each second. If this value is more than 3,000, you might have a problem with a program or hardware that is generating spurious interrupts.
If you suspect that you have a processor bottleneck, you can try the following solutions:
Use applications that are less processor - intensive.
Upgrade your processor.
If your computer supports multiple processors, add a processor.
The important counters for monitoring the disk subsystem are as follows:
PhysicalDisk - % Disk Time: This shows the amount of time the disk is busy because it is servicing read or write requests. If your disk is busy more than 90 percent of the time, you can improve performance by adding another disk channel and splitting the disk I/O requests between the channels.
PhysicalDisk - Current Disk Queue Length: This indicates the number of outstanding disk requests that are waiting to be processed. On average, this value should be less than 2.
LogicalDisk % Free Space LogicalDisk: This specifies how much free disk space is available. This counter should indicate at least 15 percent.
When you suspect to have a disk subsystem bottleneck, then firstly check your memory subsystem. Insufficient physical memory can cause excessive paging, which in turn affects the disk subsystem. If you do not have a memory problem, then you can use following solutions to improve disk performance:
Use faster disks and controllers.
Confirm that you have the latest drivers for your disk adapters.
Use disk striping to take advantage of multiple I/O channels.
Balance heavily used files on multiple I/O channels.
Add another disk controller for load balancing.
Use Disk Defragmenter to consolidate files so that disk space and data access are optimized.
If you are using the Performance Monitor utility to monitor local network traffic, the following two counters are useful for monitoring the network subsystem:
Network Interface - Bytes Total/Sec: This measures the total number of bytes sent or received from the network interface and includes all network protocols.
TCPv4 - Segments/Sec: This measures the number of bytes sent or received from the network interface and includes only the TCPv4 protocol.
You can use the following to optimize and minimize network traffic and to enhance network performance on your system:
Install and configure only the network protocols you need.
Use network cards that take advantage of your bus speed.
Use faster network cards. for example, 100 Mbps Ethernet or 1 Gbps Ethernet instead of 10 Mbps Ethernet.
Reliability Monitor:
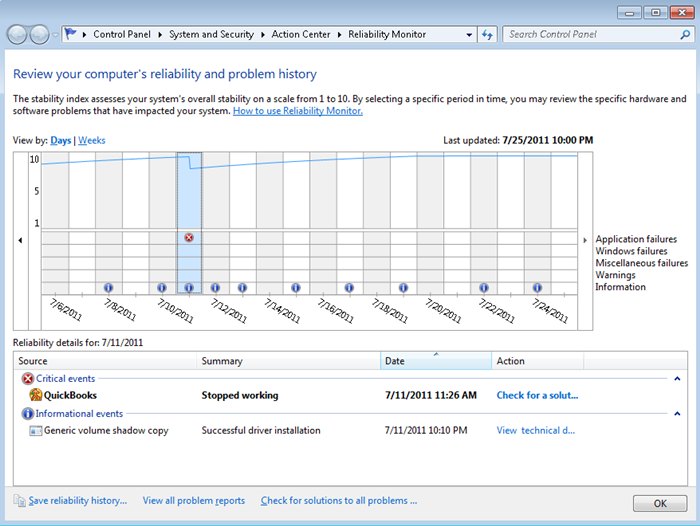
Reliability Monitor is an advanced tool that measures hardware and software problems and other changes to your computer. It provides a stability index that ranges from 1 (the least stable) to 10 (the most stable). You can use the index to help evaluate the reliability of your computer. Any change you make to your computer or problem that occurs on your computer affects the stability index. To open the Reliabilty Monitor, follow these steps:
Click Start, then choose Control Panel. Next click Action Center.
Click Maintenance. Then, under Check for solutions to problem reports, click View reliability history.
A faster way to access this is to click Start and enter perfmon /rel in the search box.
In Reliability Monitor, you can:
Click any event on the graph to view its details.
Click Days, or Weeks, to view the stability index over a specific period of time.
Click items in the Action column to view more information about them.
Click View all problem reports to view only the problems that have occurred on your computer. This view does not include the other computer events that show up in Reliability Monitor, such as events about software installation.